Mobile Design
SynCare AI
Mobile Design
Health Tech
Artificial Intelligence
How might we?
design an emotionally supportive, human-centered digital health tool that integrates fragmented data sources into a coherent, personalized narrative empowering users with clarity, empathy, and insight while fostering psychological safety and positive health reflection?
Goals
Centralize personal health data
Empower users through visibility and control
Enable early risk detection with AI-driven insights
Build trust through security and compliance (HIPAA readiness)
Research & Discovery
Conducted competitive audits of existing EHR platforms
Interviewed 7 patients and 3 clinicians to uncover pain points in data access and coordination
Identified high-need use cases: chronic condition management, medication adherence, preventive screening
Literature Review
Reviewed academic sources on digital twins, personalization, and context-aware design (e.g., Katsoulakis et al., 2024).
Explored ethical implications of AI in health systems, including transparency, bias, and user autonomy (e.g., Huang et al., 2022).
Identified trust and psychological safety as essential UX considerations, not just ethical ones.
Used literature findings to inform the project’s guiding principles and design decisions.
Stakeholder Interviews
Conducted interviews to gather insights from users and stakeholders (implied by mention of stakeholder interviews).
Used findings to shape project principles and design requirements.
Informed the development of prototypes and usability evaluations.
Helped refine goals and features based on real user needs and feedback.
Usability Evaluations
Tested prototypes with users to assess emotional support, clarity, and personalization.
Gathered feedback to iterate and improve the design.
Measured how well the tool delivered on its goals of insight, emotional support, and positive reflection.
Used evaluation results to refine the product throughout the design process.
Design & Prototyping
Developed low- and high-fidelity prototypes of the conversational interface.
Developed a modular UI system for dashboards, health summaries, and alerts
Prototyped features including:
Health timeline
AI-powered risk cards
Lab result normalizer
Claims-integrated treatment suggestions
Created low- to high-fidelity prototypes for mobile-first interfaces
Used prototypes as a tool for stakeholder feedback and usability testing.
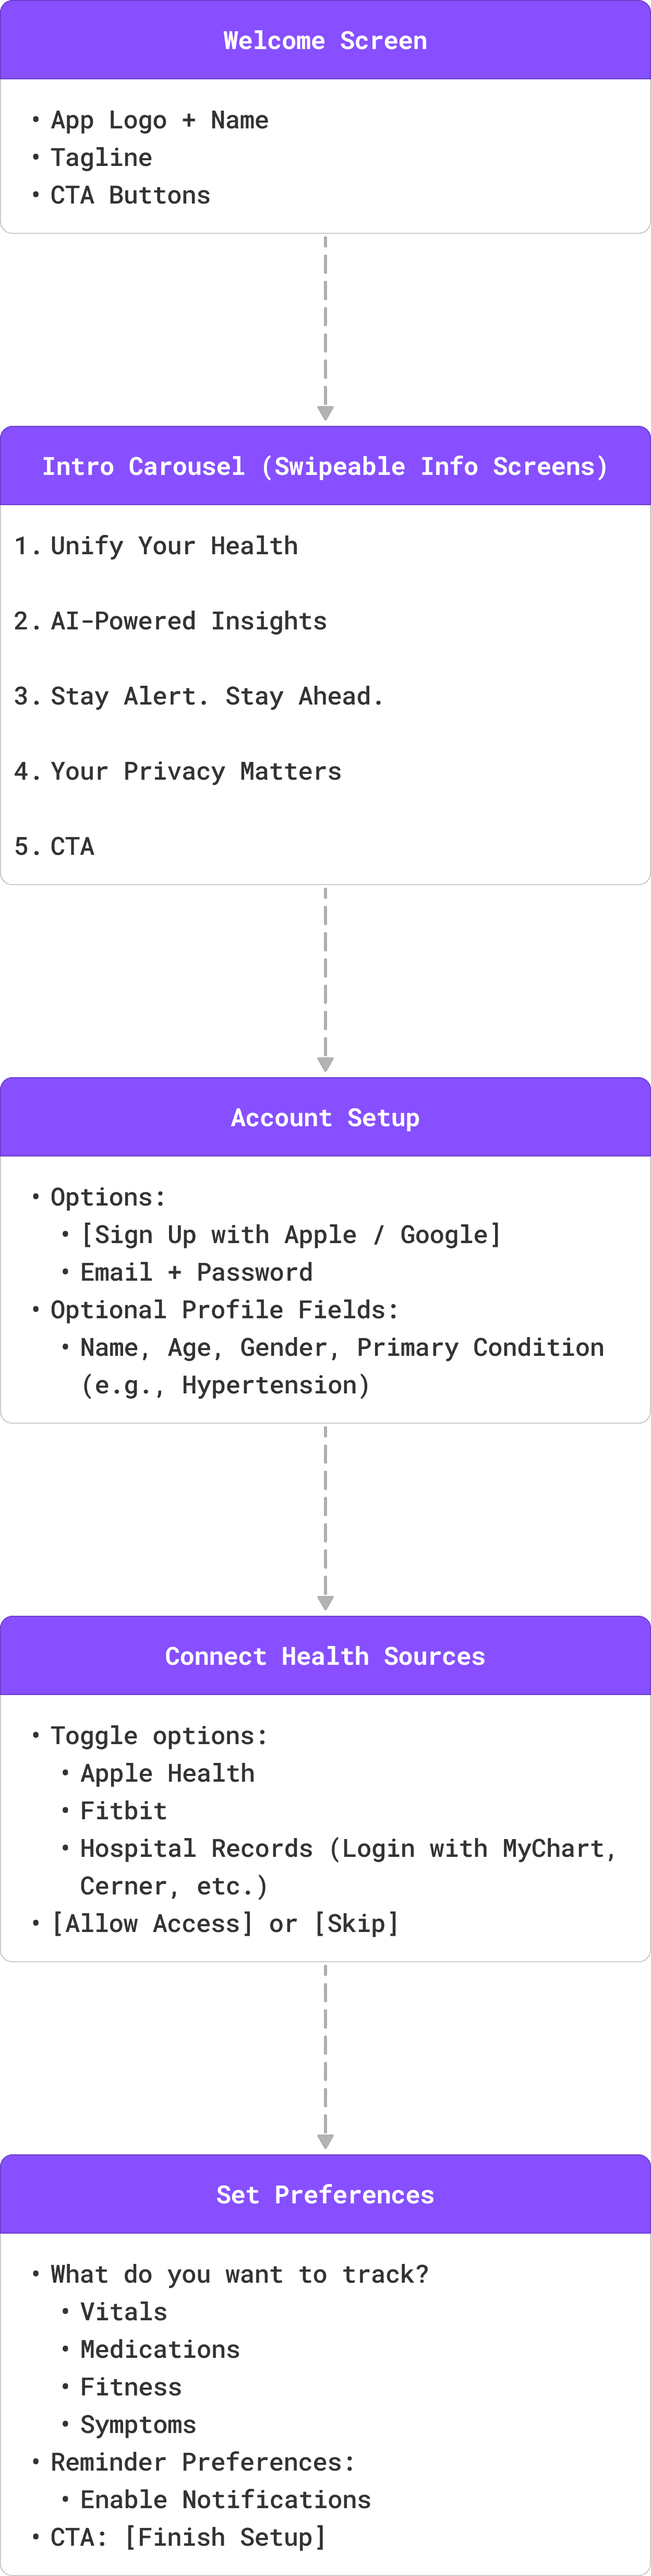
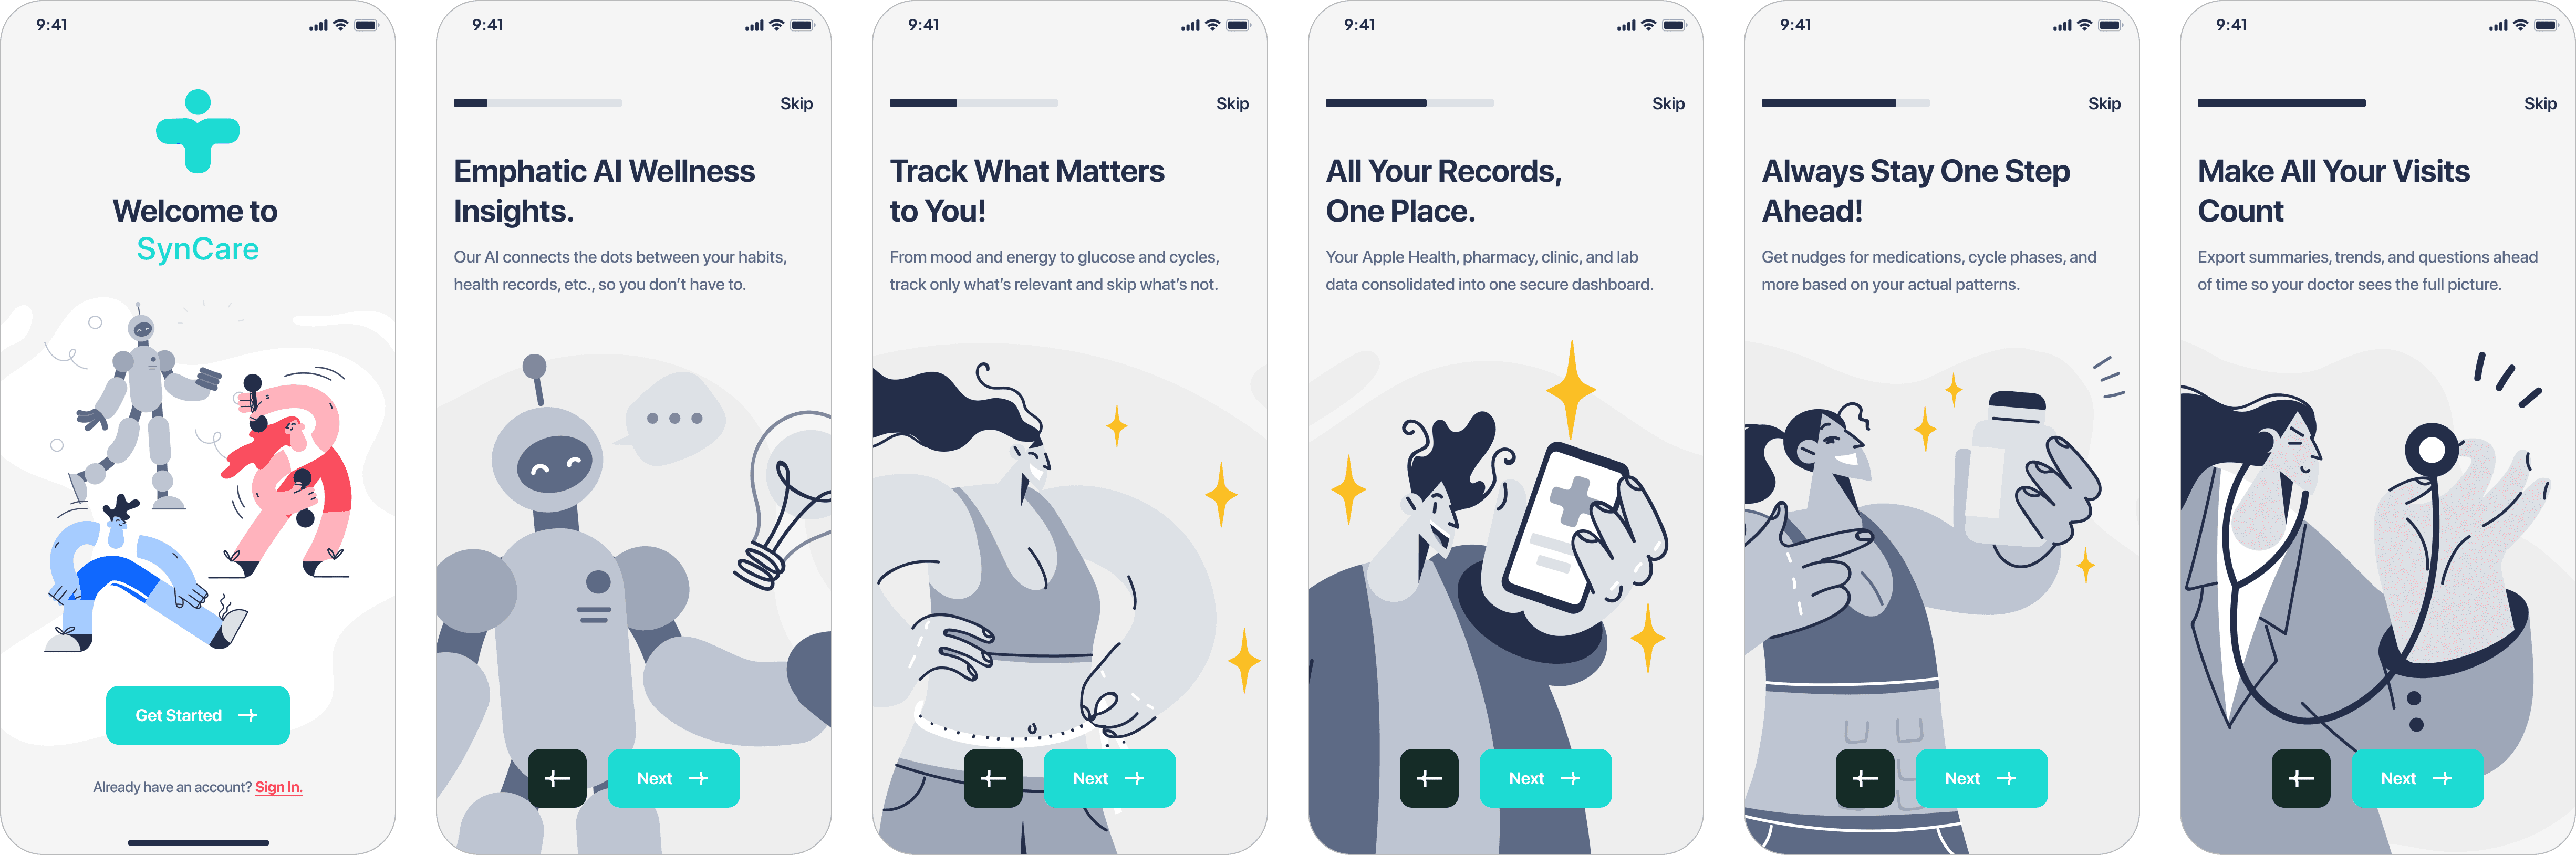
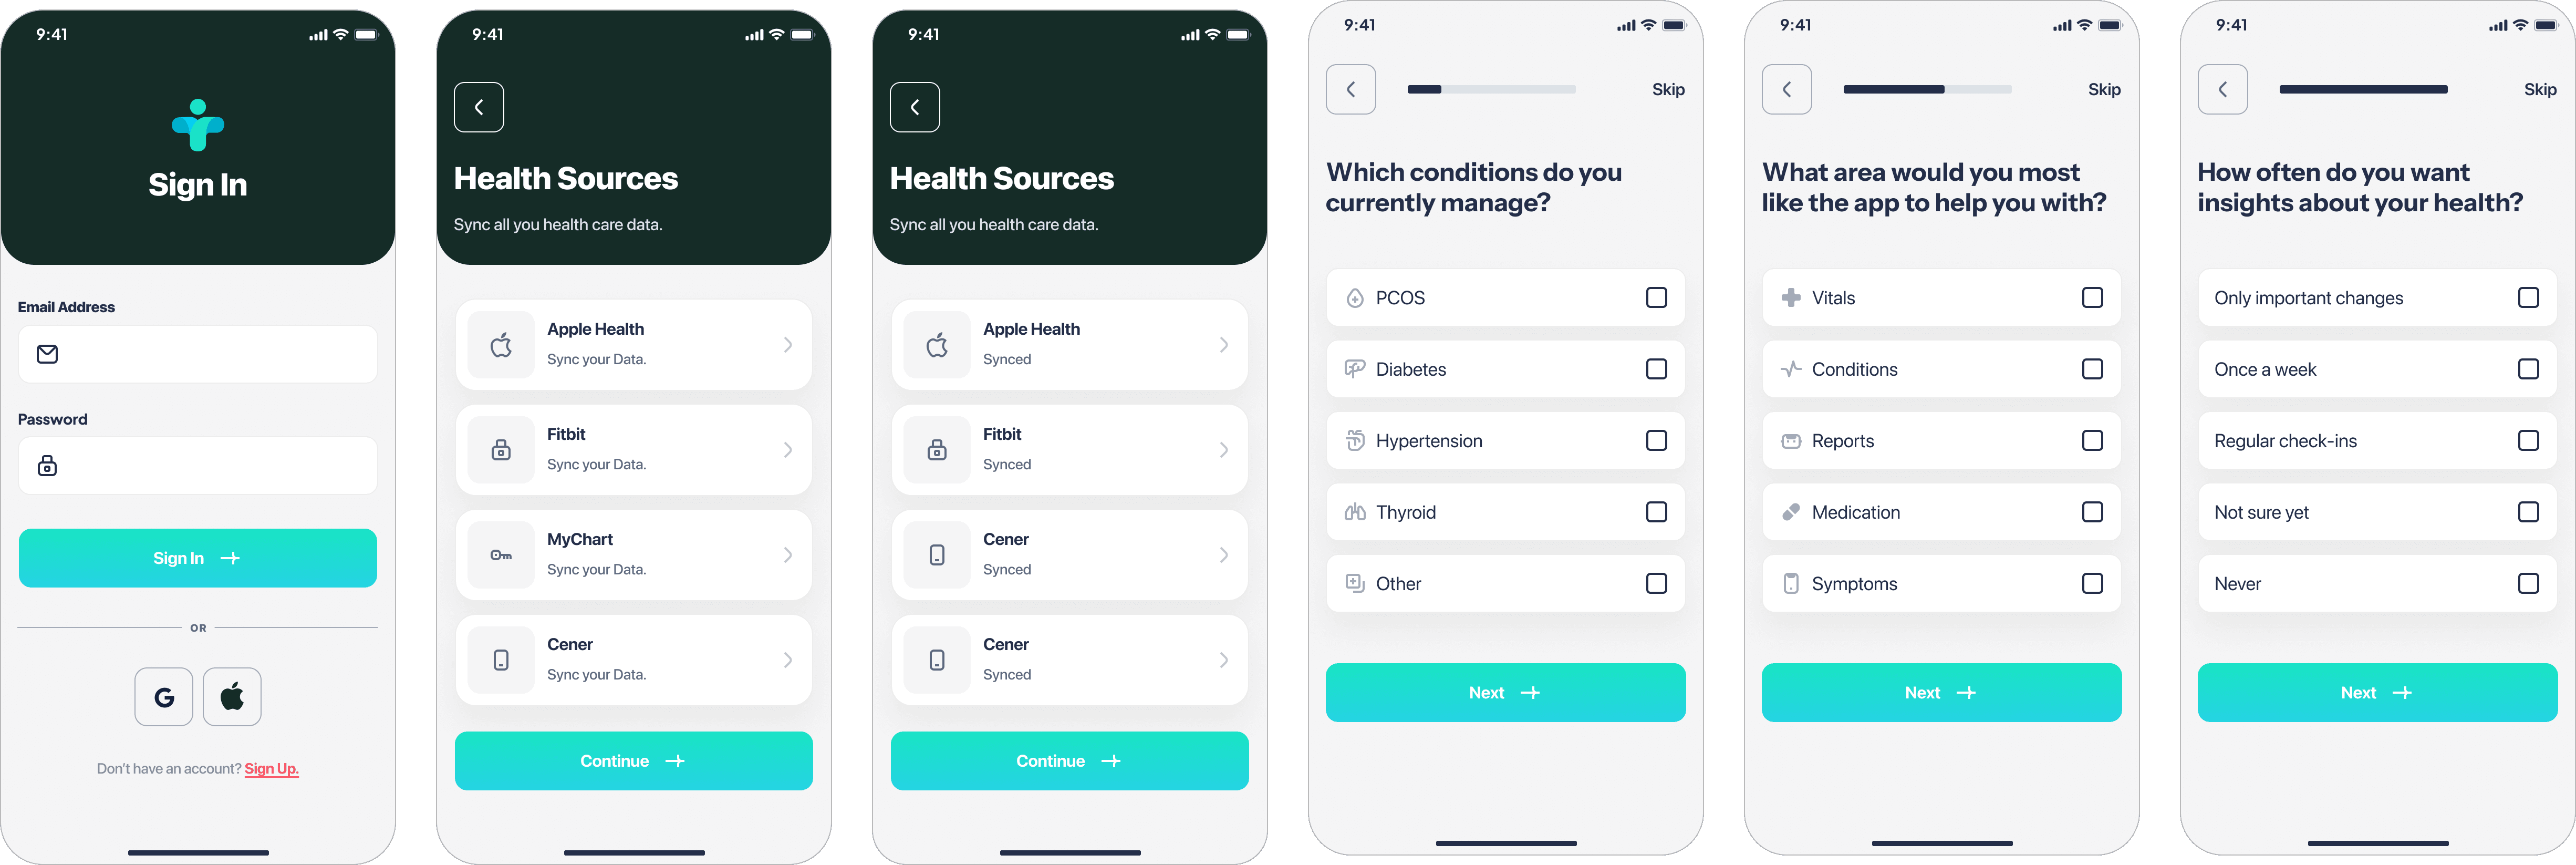
Welcome Screen
Instant Clarity + Trust
Syncare AI is designed to deliver instant clarity and trust. With a clean layout, strong brand presence, and action-driven CTAs, it sets the tone for a smooth onboarding experience. It avoids overwhelming the user, instead guiding them toward value with minimal friction—ideal for a health-focused app where trust, simplicity, and control are critical.

Converse with all your health apps
The AI Chat feature turns static health data into natural, human-like dialogue. It builds on the previous screens by offering a conversational way to recall past appointments, track medication, and understand fitness and vitals history. Users can ask follow-up questions, get summarized reports, and take quick actions, all in one thread.
Why this works?
This chat interface gives users clarity without requiring clinical literacy. It reduces friction by letting users engage through questions, while still maintaining access to structured info like medication logs and appointment summaries. It also bridges context between past records and next actions.


AI Powered Vitals + Medication Dashboard
AI-driven predictions increased trust when paired with human-readable explanations
This dashboard experience is designed to surface real-time health insights in a way that is personalized, context-rich, and actionable. Each screen adapts based on data sources, providing tailored summaries, timely medication reminders, and AI-generated insights, all while keeping the interface friendly and non-clinical.
Why this works?
The flow balances critical health data (e.g. blood glucose, vitals, meds) with human-centered messaging (“Hi, Lola!”). Microcopy explains why something is flagged, while AI tips and upcoming tasks create a sense of proactive care. This reduces overwhelm, builds trust, and encourages behavior change.


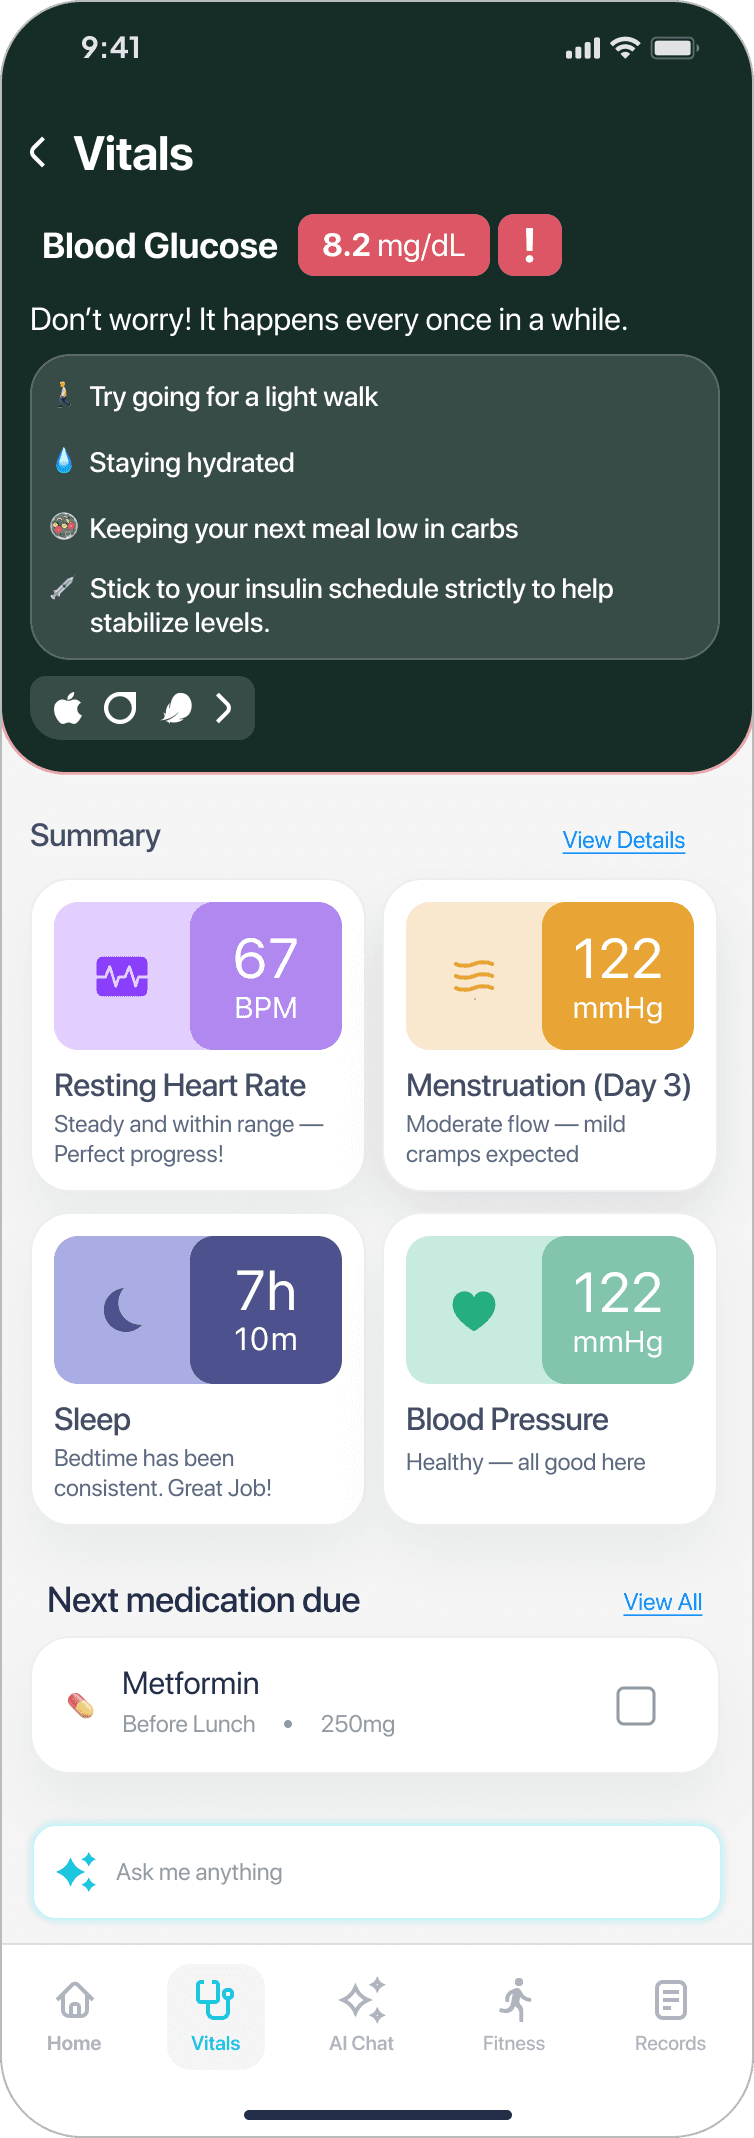
A Deep dive into Vitals
The vitals screen gives users a quick, reassuring overview of key health stats with contextual support when something is off. When blood glucose is high, the UI responds with calm messaging and clear, actionable tips, helping users feel informed rather than alarmed. The layout maintains a consistent card structure to support habit formation and quick scanning.
Why this works?
It blends medical accuracy with emotional support, using friendly language and visual clarity to encourage positive behavior. The experience is personalized and educational without being overwhelming, designed to help users build trust and stay engaged with their health data.

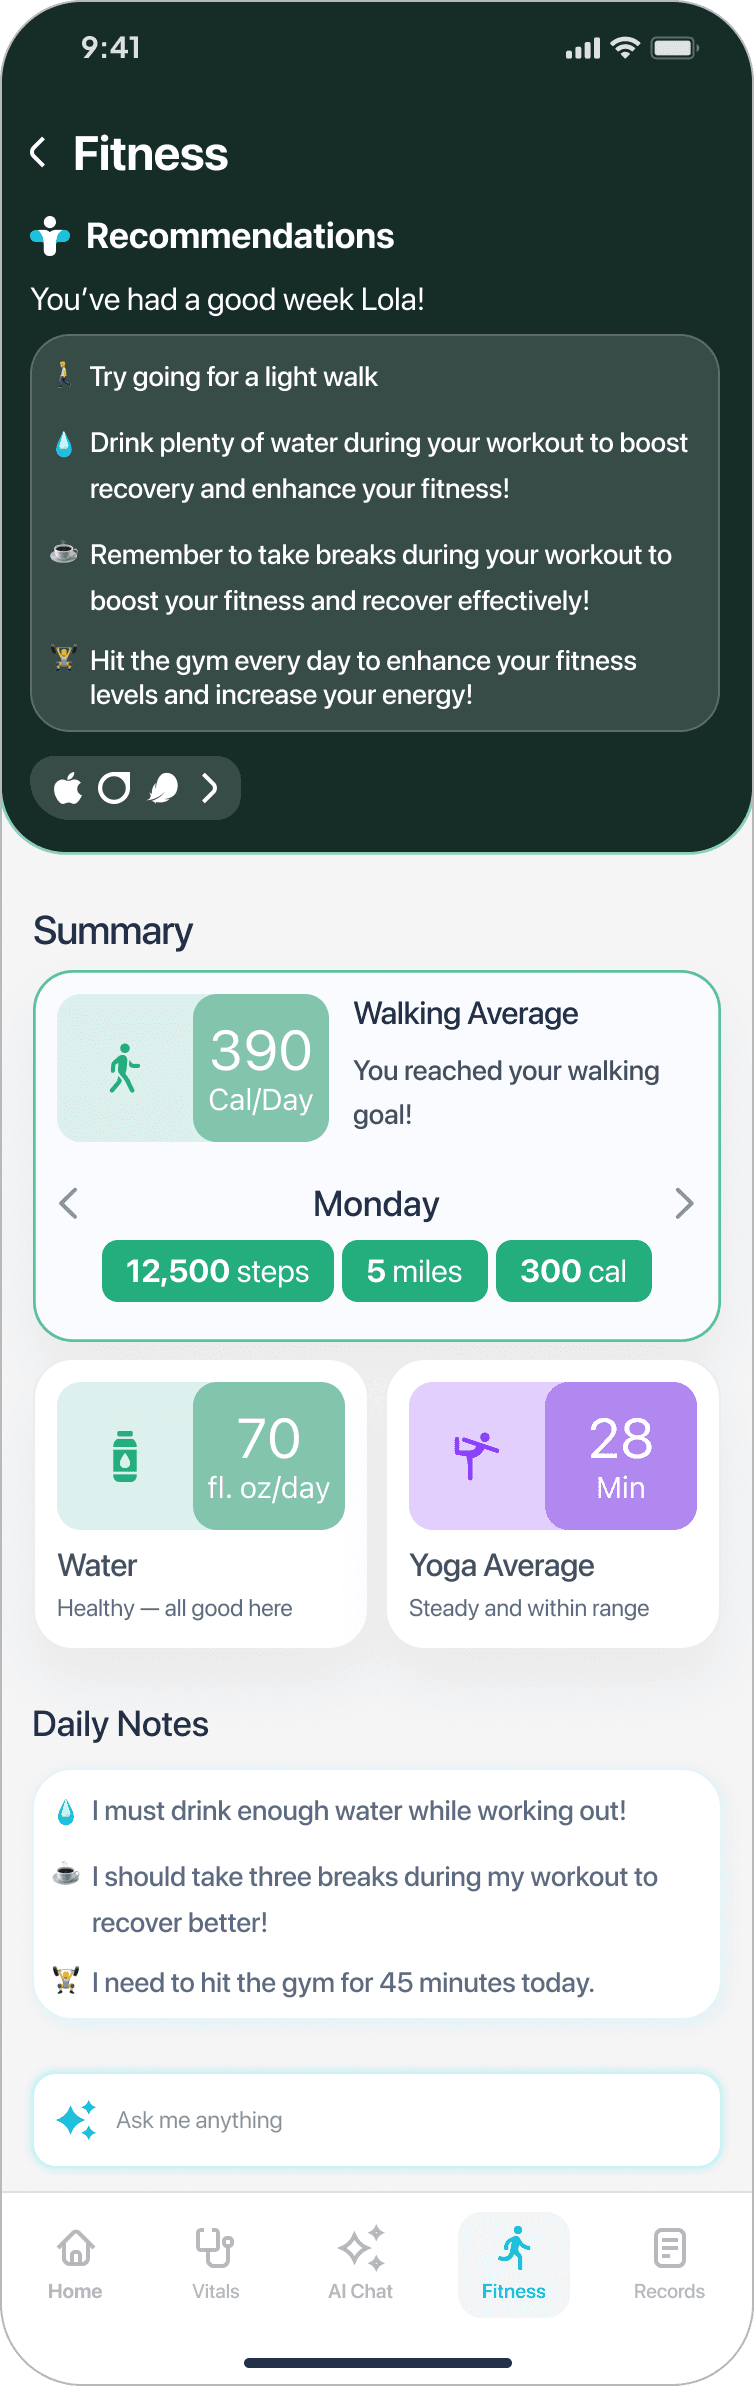
Your personal AI fitness coach
The fitness page provides users with daily movement insights, hydration levels, and exercise logs, paired with personalized AI-driven recommendations. Visual summaries like step count, distance, calories, and yoga time are clearly presented alongside motivational tips and daily notes.
Why this works?
It reinforces positive behavior through encouraging feedback, while surfacing key activity metrics in a glanceable format. The addition of user-generated daily notes supports self-reflection and accountability, creating a loop between awareness and action.